

DevExpress XtraCharts如何在Web页面中添加图表(运行示例)
作者:huhm 来源:本站原创 浏览:Loading...次 发布时间:2012-05-18 评论:0条
本示例演示了DevExpress XtraCharts开发中,在Web页面中如何通过点击按钮生成并显示图表。实现此效果还有一个方法,请参阅:DevExpress XtraCharts ASPxCallbackPanel回调时如何添加图表(运行示例)。
下面将为你演示如何实现图表的添加。
1、创建一个新的ASP.NET Web应用程序(Visual Studio 2008或2010),或打开一个现有的。
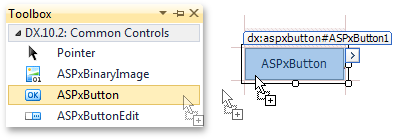
2、切换到Default.aspx页面的设计视图,从DX.11.2:公共控件工具栏拖放一个ASPxButton到页面中。处理它的Click事件,生成一个Web图表。
3、将所需的程序集添加到项目中。
注意:如果你喜欢,控件也可以自动添加(拖放一个WebChartControl实例到页面中),这会影响你的web应用程序的Web.config文件。关于这些变化的更多信息,请参阅为DevExpress XtraCharts添加一个Web图表。
4、现在,双击ASPxButton1,处理它的Click事件。将下面的代码添加到事件处理程序中。
注意:获取元素和动态创建WebChartControl的属性之前,应先添加Page.Form.Controls程序集。
using System;
using DevExpress.XtraCharts;
using DevExpress.XtraCharts.Web;
// ...
protected void ASPxButton1_Click(object sender, EventArgs e) {
      // Create a WebChartControl instance.
       WebChartControl WebChartControl1 = new WebChartControl();
        // Add the chart to the form.
       // Note that a chart isn't initialized until it's added to
the form's collection of controls.
       this.form1.Controls.Add(WebChartControl1);
        // Create a line series and add points to it.
       Series series1 = new Series("My Series", ViewType.Line);
      series1.Points.Add(new SeriesPoint("A", new double[] { 2 }));
      series1.Points.Add(new SeriesPoint("B", new double[] { 7 }));
      series1.Points.Add(new SeriesPoint("C", new double[] { 5 }));
      series1.Points.Add(new SeriesPoint("D", new double[] { 9 }));
        // Add the series to the chart.
       WebChartControl1.Series.Add(series1);
}
VB源码: Imports System
Imports DevExpress.XtraCharts
Imports DevExpress.XtraCharts.Web
' ...
Protected Sub ASPxButton1_Click(ByVal sender As Object, ByVal e As EventArgs)
' Create a WebChartControl instance.
Dim WebChartControl1 As New WebChartControl()
' Add the chart to the form.
' Note that a chart isn't initialized until it's added to the form's
collection of controls.
Me.form1.Controls.Add(WebChartControl1)
' Create a line series and add points to it.
Dim series1 As New Series("My Series", ViewType.Line)
series1.Points.Add(New SeriesPoint("A", New Double() { 2 }))
series1.Points.Add(New SeriesPoint("B", New Double() { 7 }))
series1.Points.Add(New SeriesPoint("C", New Double() { 5 }))
series1.Points.Add(New SeriesPoint("D", New Double() { 9 }))
' Add the series to the chart.
WebChartControl1.Series.Add(series1)
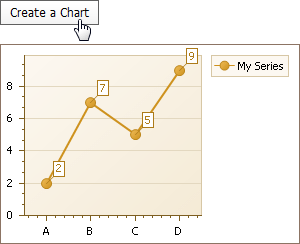
End Sub 运行Web应用程序,单击ASPxButton1看图表效果。
欢迎任何形式的转载,但请务必注明出处,尊重他人劳动成果
转载请注明:文章转载自:DevExpress控件中文网 [http://www.devexpresscn.com/]
本文地址:http://www.devexpresscn.com/DevExpress-Resources/Demo-102.html
关键字: Web页面 图表 XtraCharts Chart
评论列表
暂无评论
请谈谈你的看法 请使用IE或者Firefox浏览器,暂不支持Chrome!


慧都控件网为DevExpress界面控件的中国地区唯一正式授权经销商,正版控件销售公司,授权代理商,经销商及合作伙伴。
电话:400-700-1020
023-66090381
邮箱:sales@evget.com
相关资源
- ASP.NET ASPxGridView使用方法大全
- DevExpress汉化方法详解
- 如何创建ASP.NET向导界面
- ASPxPivotGrid支持XML数据源吗?
- 用 ASP.NET实现鼠标滚动自动加载内容
- 使用XAF构建基于工作流的授权应用程序
- DevExpress使用技巧总结
- WinForms和ASP.NET ERP系统完美开发
- GridControl使用方法总结
- ToolTipController 如何设置显示时间和边框颜色
- GridView如何设置页脚模板
- 为什么GridControl在水平滚动后的数据丢失
- DevExpress汉化资源(本地化中文包)下载
- 用ASP.NET控件创建iOS Web应用程序
- ASPxPageControl在回调时如何显示面板加载
- ASPxGridView如何更改自定义窗口中列的顺序
- 如何将表单和UserControl转换成XtraForm和XtraUserControl
- 如何添加新的XtraForm、RibbonForm和XtraUserControl控件
- 本地化(汉化).NET Windows Forms控件
- 如何在DetailView中的显示所有细节而不单是组合框


