 联系电话:023-68661681
使用绑定到数据的系列创建Chart3D控件
在本课程中,您将完成可视化数据源所需的步骤。
应执行以下步骤。
- 步骤1.准备申请表
- 步骤2.添加图表和系列绑定到数据
- 步骤3.配置系列视图
- 结果
扩展步骤1.准备应用程序
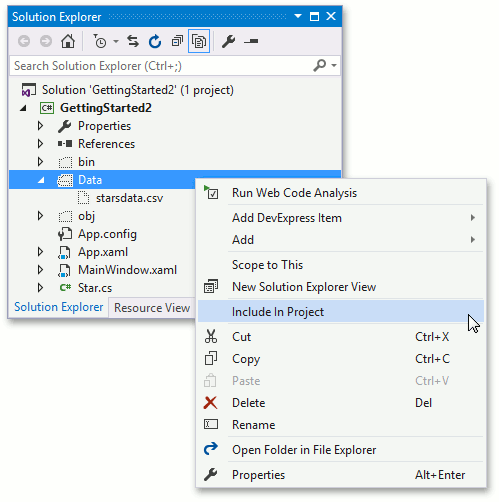
您将使用Model和ViewModel类将数据文件添加到项目中。
- 运行MS Visual Studio 2010,2012,2013或2015。
- 创建一个新的WPF应用程序项目。
- 添加新的模型类。 为此,在解决方案资源管理器中右键单击该项目。 从调用的菜单中,选
择Add | New Item... 元素。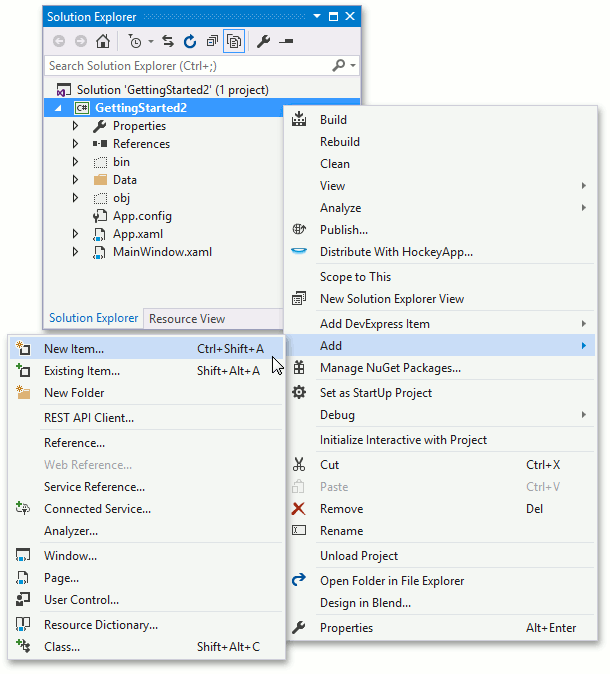
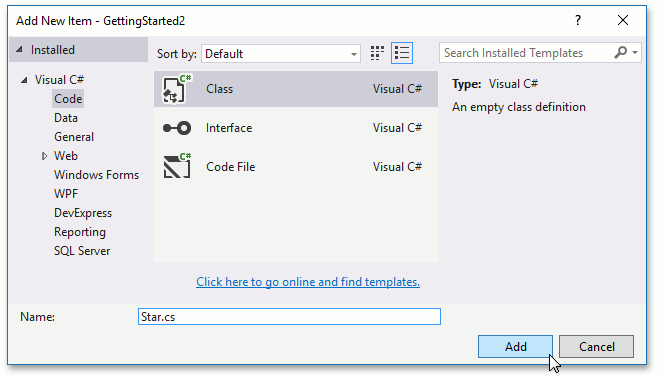
- 在调用的“Add New Item”对话框中,从项列表中选择“Code”组,然后选择“Class”。 将文件名设置为Star.cs,然后单击“OK”。
- 使用以下代码替换添加的文件包含的代码,该代码描述了本入门课程中使用的模型对象。
namespace GettingStarted2 {
    public struct Star {
        public int HipID { get; private set; }
        public string Spectr { get; private set; }
        public double Luminocity { get; private set; }
        public double ColorIndex { get; private set; }
        public double X { get; private set; }
        public double Y { get; private set; }
        public double Z { get; private set; }

        public Star(
                int id,
                double x,
                double y,
                double z,
                string spectr,
                double luminocity,
                double colorIndex
        ) {
            HipID = id;
            X = x;
            Y = y;
            Z = z;
            Spectr = spectr;
            Luminocity = luminocity;
            ColorIndex = colorIndex;
        }
    }
}
Public Class Star
    Dim mHipID As Int32
    Dim mSpectr As String
    Dim mX, mY, mZ, mLuminocity, mColorIndex As Double

    Public ReadOnly Property HipID() As Int32
        Get
            Return mHipID
        End Get
    End Property

    Public ReadOnly Property Spectr() As String
        Get
            Return mSpectr
        End Get
    End Property

    Public ReadOnly Property X() As Double
        Get
            Return mX
        End Get
    End Property

    Public ReadOnly Property Y() As Double
        Get
            Return mY
        End Get
    End Property

    Public ReadOnly Property Z() As Double
        Get
            Return mZ
        End Get
    End Property

    Public ReadOnly Property Luminocity() As Double
        Get
            Return mLuminocity
        End Get
    End Property

    Public ReadOnly Property ColorIndex() As Double
        Get
            Return mColorIndex
        End Get
    End Property

    Public Sub New(
            ByVal id As Int32,
            ByVal x As Double,
            ByVal y As Double,
            ByVal z As Double,
            ByVal spectr As String,
            ByVal luminocity As Double,
            ByVal colorIndex As Double)
        mHipID = id
        mX = x
        mY = y
        mZ = z
        mSpectr = spectr
        mLuminocity = luminocity
        mColorIndex = colorIndex
    End Sub
End Class
using System;
using System.Collections.Generic;
using System.Collections.ObjectModel;
using System.Globalization;
using System.IO;
using System.Windows;
using System.Windows.Resources;

namespace GettingStarted2 {
    public class StarStatisticsViewModel {
        public IEnumerable<Star> Stars { get; }

        public StarStatisticsViewModel() {
            Stars = StarStatisticsLoader.Load("/Data/starsdata.csv");
        }
    }

    static class StarStatisticsLoader {
        public static IEnumerable<Star> Load(string filepath) {
            StreamResourceInfo streamInfo = Application.GetResourceStream(
                new Uri(filepath, UriKind.RelativeOrAbsolute)
            );
            StreamReader reader = new StreamReader(streamInfo.Stream);
            Collection<Star> stars = new Collection<Star>();
            while (!reader.EndOfStream) {
                String dataLine = reader.ReadLine();
                String[] serializedValues = dataLine.Split(';');
                stars.Add(
                    new Star(
                        id: Convert.ToInt32(serializedValues[0], CultureInfo.InvariantCulture),
                        x: Convert.ToDouble(serializedValues[3], CultureInfo.InvariantCulture),
                        y: Convert.ToDouble(serializedValues[4], CultureInfo.InvariantCulture),
                        z: Convert.ToDouble(serializedValues[5], CultureInfo.InvariantCulture),
                        spectr: serializedValues[1],
                        luminocity: Convert.ToDouble(serializedValues[6], CultureInfo.InvariantCulture),
                        colorIndex: Convert.ToDouble(serializedValues[2], CultureInfo.InvariantCulture)
                    )
                );
            }

            return stars;
        }
    }
}
Imports System.Collections.ObjectModel
Imports System.Globalization
Imports System.IO
Imports System.Windows.Resources

Public Class StarDataViewModel
    Dim mStars As IEnumerable(Of Star)
    Public ReadOnly Property Stars As IEnumerable(Of Star)
        Get
            Return mStars
        End Get
    End Property

    Public Sub New()
        mStars = StarStatisticsLoader.Load("/Data/starsdata.csv")
    End Sub
End Class

Public Module StarStatisticsLoader
    Public Function Load(ByVal filepath As String) As IEnumerable(Of Star)
        Dim streamInfo As StreamResourceInfo = Application.GetResourceStream(
                New Uri(filepath, UriKind.RelativeOrAbsolute)
            )
        Dim reader As StreamReader = New StreamReader(streamInfo.Stream)
        Dim stars As Collection(Of Star) = New Collection(Of Star)()
        While (Not reader.EndOfStream)
            Dim dataLine As String = reader.ReadLine()
            Dim serializedValues As String() = dataLine.Split(";")
            stars.Add(
                    New Star(
                        id:=Convert.ToInt32(serializedValues(0), CultureInfo.InvariantCulture),
                        x:=Convert.ToDouble(serializedValues(3), CultureInfo.InvariantCulture),
                        y:=Convert.ToDouble(serializedValues(4), CultureInfo.InvariantCulture),
                        z:=Convert.ToDouble(serializedValues(5), CultureInfo.InvariantCulture),
                        spectr:=serializedValues(1),
                        luminocity:=Convert.ToDouble(serializedValues(6), CultureInfo.InvariantCulture),
                        colorIndex:=Convert.ToDouble(serializedValues(2), CultureInfo.InvariantCulture)
                    )
                )
        End While
        Return stars
    End Function
End Module
准备工作结束了。 下一组步骤详细说明了如何添加Chart3D控件,分配数据和自定义显示设置。
扩展步骤2.添加图表和系列绑定到数据
将添加Chart3D控件,并将使用视图模型数据填充一系列。
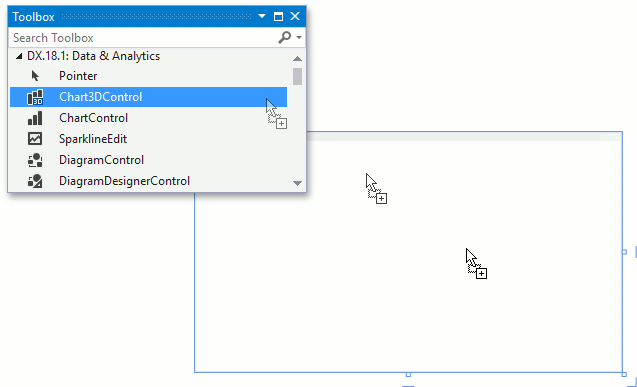
- 要将Chart3DControl添加到表单,请将其从工具箱中拖出。 该控件可在DX.18.2:数据和分析选项卡中找到。
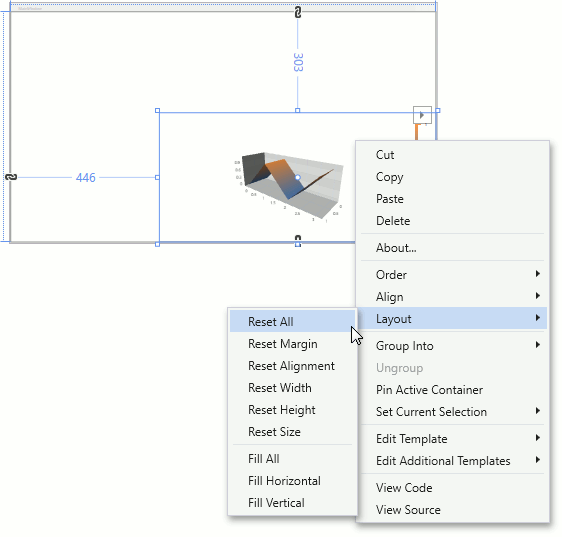
- 放置控件后,右键单击它,然后从调用的菜单中选择Layout | Reset All。
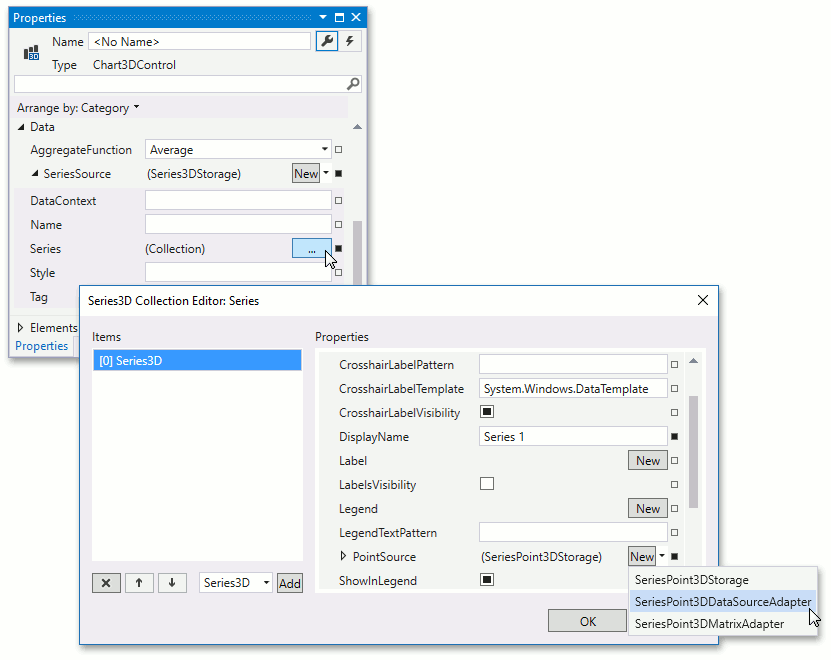
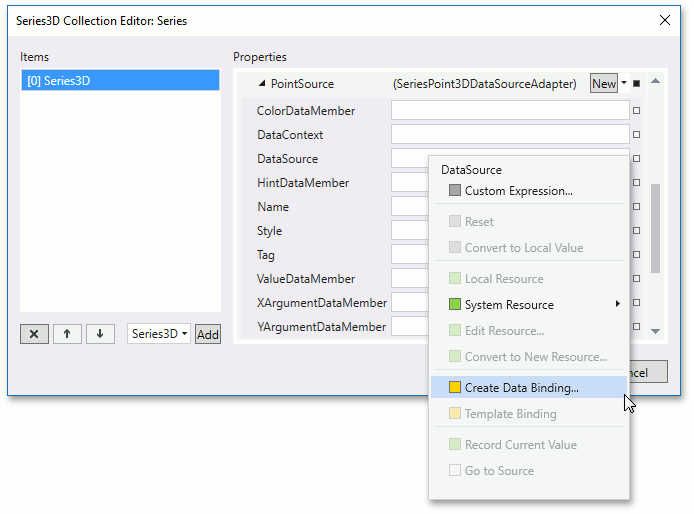
- 现在,在Chart3D系列中显示视图模型数据。 为此,请在“属性”窗口中找到Chart3DControl.SeriesSource属性并展开它。 找到Series3DStorage.Series属性,然后单击它对面的省略号按钮。 然后,在调用的Series3D Collection Editor中,选择Series3D系列,在Properties列表中,将Series3D.PointSource属性设置为SeriesPoint3DDataSourceAdapter。
- 找到SeriesPoint3DDataSourceAdapter.DataSource属性,然后单击属性标记。 从调用的菜单中,选择Create Data Binding ....
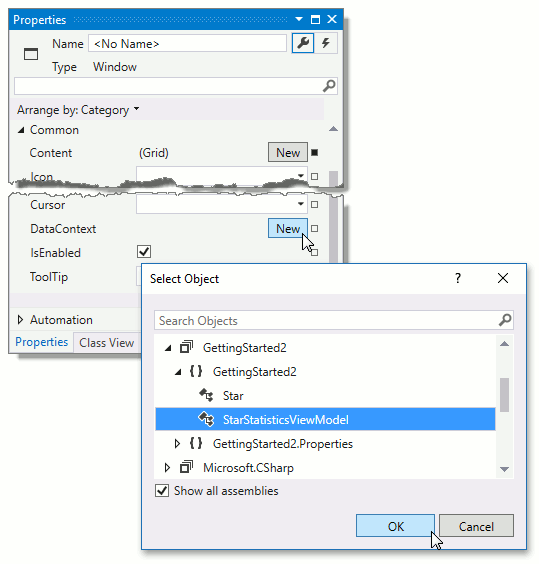
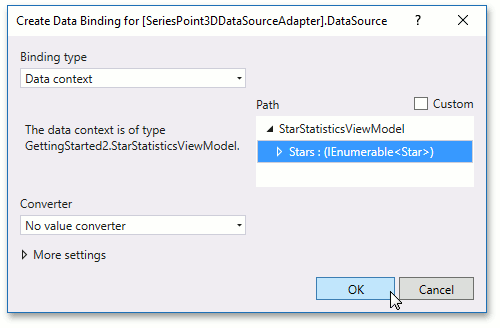
- 在调用的“Create Data Binding”对话框窗口中,选择ViewModel的Stars属性,然后单击“OK”。
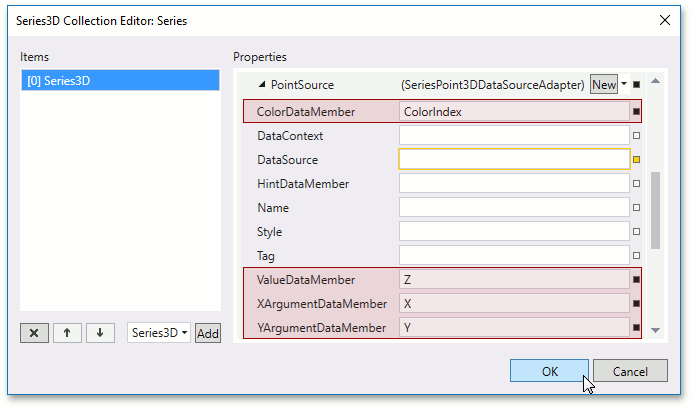
- 现在,指定用于参数和点值的数据成员的名称。 将Series3DDataSourceAdapter.XArgumentDataMember属性设置为X,将Series3DDataSourceAdapter.YAgugumentDataMember设置为Y,将Series3DDataSourceAdapter.ValueDataMember设置为Z.此外,将SeriesPoint3DDataSourceAdapter.ColorDataMember属性设置为ColorIndex。 此属性指定的数据源值将使点着色。 单击“确定”关闭编辑器并保存更改。
- Chart3D数据已配置。 目前,该系列的XAML标记应如下所示。
<dxc:Series3D DisplayName="Series 1">
    <dxc:Series3D.View>
        <dxc:SurfaceSeriesView>
            <dxc:SurfaceSeriesView.FillStyle>
                <dxc:GradientFillStyle/>
            </dxc:SurfaceSeriesView.FillStyle>
        </dxc:SurfaceSeriesView>
    </dxc:Series3D.View>
    <dxc:SeriesPoint3DDataSourceAdapter DataSource="{Binding Stars}"
                                        XArgumentDataMember="X"
                                        YArgumentDataMember="Y"
                                        ValueDataMember="Z"
                                        ColorDataMember="ColorIndex"/>
</dxc:Series3D>
扩展步骤3.配置系列视图
将配置系列的外观。 将分配不同的系列视图。 此外,将使用ColorIndex值对点进行着色的着色器来提供颜色。
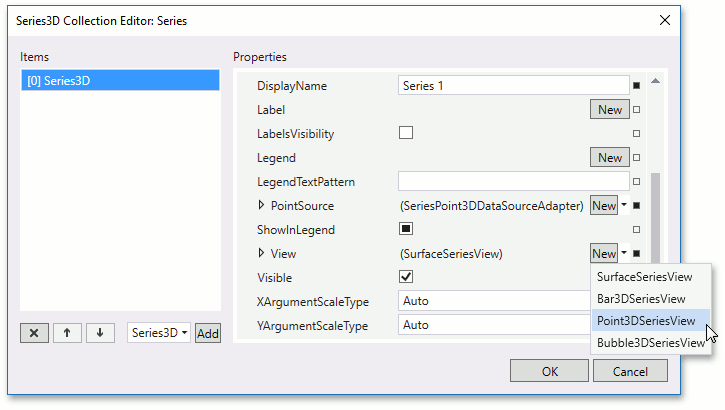
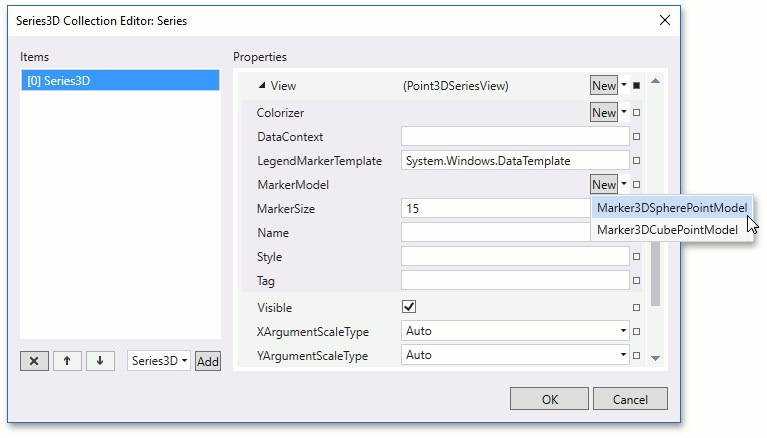
- 打开Series Collection Editor并选择Series3D。 找到Series3DBase.View属性并将其设置为Point3DSeriesView。
- 展开视图属性,找到Marker3DSeriesView.MarkerModel属性并将其分配给SphereMarker3DModel对象。
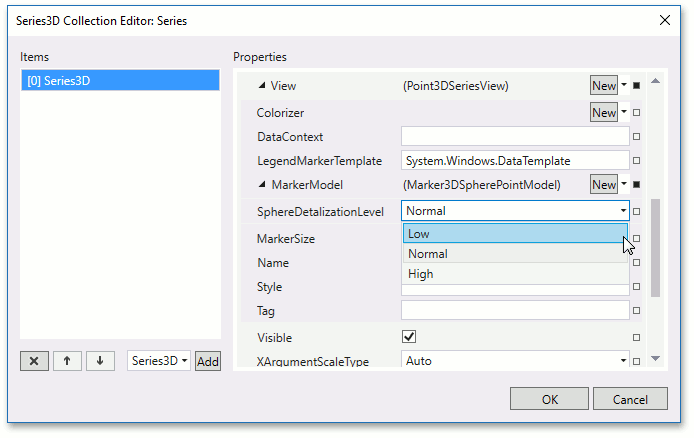
- 然后,展开模型属性并将其Marker3DSpherePointModel.SphereDetalizationLevel属性设置为Low。 这应该可以提高应用性能。
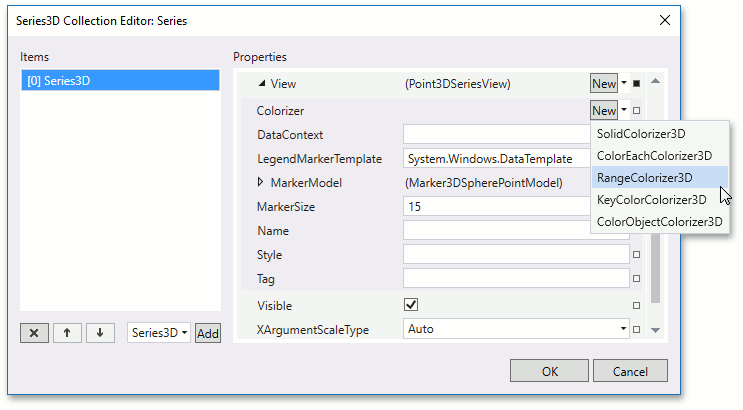
- 找到Series3DViewBase.Colorizer属性并将其设置为RangeColorizer3D。
- 展开着色器的属性并将其RangeColorizer3D.RangeStops设置为-0.4 0.4 1.8 2。
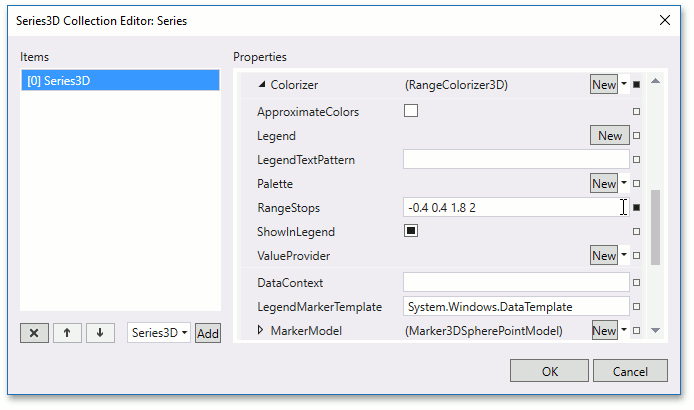
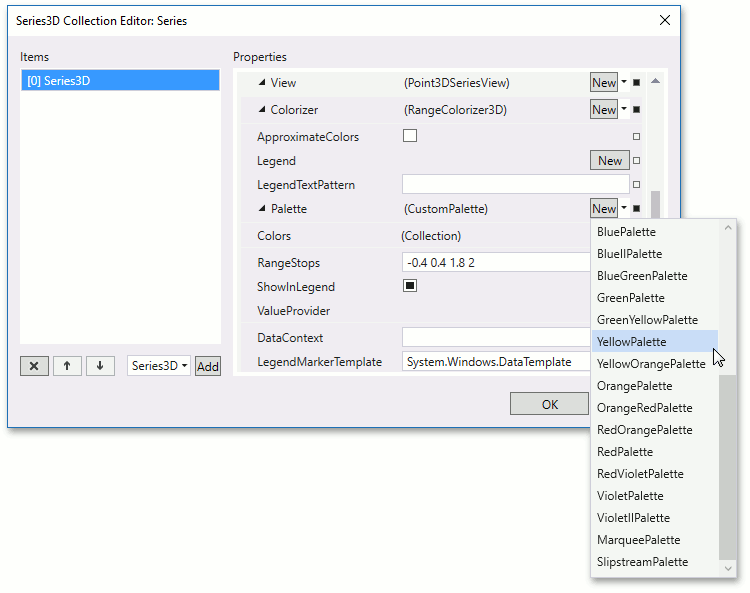
- 将YellowPalette对象指定为PaletteColorizer3DBase.Palette属性值。
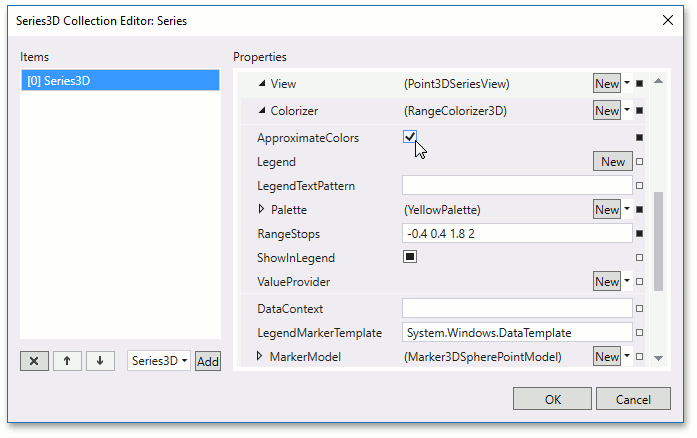
- 将RangeColorizer3D.ApproximateColors属性设置为true。
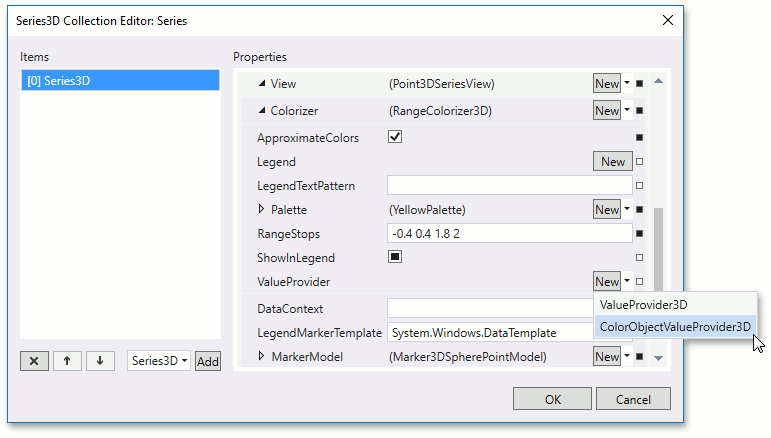
- 最后,将RangeColorizer3D.ValueProvider设置为新的ColorObjectValueProvider3D对象,然后单击“OK”关闭编辑器并保存更改。
- 目前,该系列的XAML标记应如下所示。
<dxc:Series3D DisplayName="Series 1">
    <dxc:Series3D.View>
        <dxc:Point3DSeriesView>
            <dxc:Point3DSeriesView.MarkerModel>
                <dxc:Marker3DSpherePointModel SphereDetalizationLevel="Low"/>
            </dxc:Point3DSeriesView.MarkerModel>
            <dxc:Point3DSeriesView.Colorizer>
                <dxc:RangeColorizer3D RangeStops="-0.4 0.4 1.8 2"
                                      ApproximateColors="True">
                    <dxc:RangeColorizer3D.ValueProvider>
                        <dxc:ColorObjectValueProvider3D/>
                    </dxc:RangeColorizer3D.ValueProvider>
                    <dxc:RangeColorizer3D.Palette>
                        <dxc:YellowPalette/>
                    </dxc:RangeColorizer3D.Palette>
                </dxc:RangeColorizer3D>
            </dxc:Point3DSeriesView.Colorizer>
        </dxc:Point3DSeriesView>
    </dxc:Series3D.View>
    <!--Point Source Configuration -->
</dxc:Series3D>
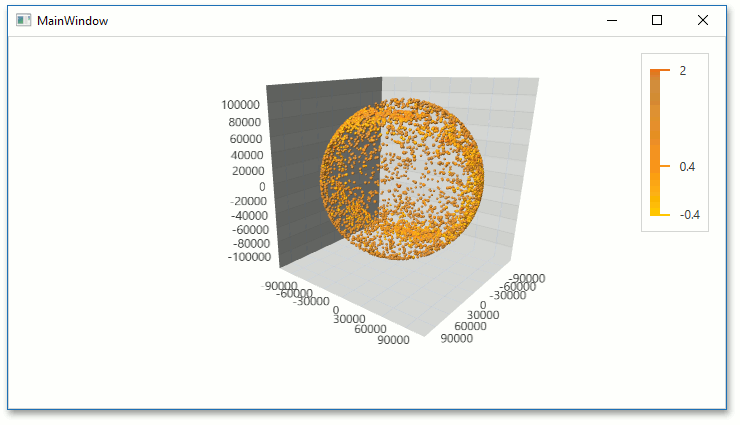
结果
下图显示了已启动的应用程序。
以下代码是此入门课程的结果。
namespace GettingStarted2 {
    public class Star {
        public int HipID { get; private set; }
        public string Spectr { get; private set; }
        public double Luminocity { get; private set; }
        public double ColorIndex { get; private set; }
        public double X { get; private set; }
        public double Y { get; private set; }
        public double Z { get; private set; }

        public Star(
                int id,
                double x,
                double y,
                double z,
                string spectr,
                double luminocity,
                double colorIndex
        ) {
            HipID = id;
            X = x;
            Y = y;
            Z = z;
            Spectr = spectr;
            Luminocity = luminocity;
            ColorIndex = colorIndex;
        }
    }
}
<Window
        xmlns="http://schemas.microsoft.com/winfx/2006/xaml/presentation"
        xmlns:x="http://schemas.microsoft.com/winfx/2006/xaml"
        xmlns:d="http://schemas.microsoft.com/expression/blend/2008"
        xmlns:mc="http://schemas.openxmlformats.org/markup-compatibility/2006"
        xmlns:local="clr-namespace:GettingStarted2"
        xmlns:dxc="http://schemas.devexpress.com/winfx/2008/xaml/charts"
        x:Class="GettingStarted2.MainWindow"
        mc:Ignorable="d"
        Title="MainWindow" Height="720" Width="1280">
    <Window.DataContext>
        <local:StarStatisticsViewModel/>
    </Window.DataContext>
    <Grid>
        <dxc:Chart3DControl>
            <dxc:Chart3DControl.Legends>
                <dxc:Legend/>
            </dxc:Chart3DControl.Legends>
            <dxc:Series3DStorage>
                <dxc:Series3D DisplayName="Series 1">
                    <dxc:Series3D.View>
                        <dxc:Point3DSeriesView>
                            <dxc:Point3DSeriesView.MarkerModel>
                                <dxc:Marker3DSpherePointModel SphereDetalizationLevel="Low"/>
                            </dxc:Point3DSeriesView.MarkerModel>
                            <dxc:Point3DSeriesView.Colorizer>
                                <dxc:RangeColorizer3D RangeStops="-0.4 0.4 1.8 2"
                                                      ApproximateColors="True">
                                    <dxc:RangeColorizer3D.ValueProvider>
                                        <dxc:ColorObjectValueProvider3D/>
                                    </dxc:RangeColorizer3D.ValueProvider>
                                    <dxc:RangeColorizer3D.Palette>
                                        <dxc:YellowPalette/>
                                    </dxc:RangeColorizer3D.Palette>
                                </dxc:RangeColorizer3D>
                            </dxc:Point3DSeriesView.Colorizer>
                        </dxc:Point3DSeriesView>
                    </dxc:Series3D.View>
                    <dxc:SeriesPoint3DDataSourceAdapter DataSource="{Binding Stars}"
                                                        XArgumentDataMember="X"
                                                        YArgumentDataMember="Y"
                                                        ValueDataMember="Z"
                                                        ColorDataMember="ColorIndex"/>
                </dxc:Series3D>
            </dxc:Series3DStorage>
        </dxc:Chart3DControl>
    </Grid>
</Window>
Imports System.Collections.ObjectModel
Imports System.Globalization
Imports System.IO
Imports System.Windows.Resources

Public Class StarDataViewModel
    Dim mStars As IEnumerable(Of Star)
    Public ReadOnly Property Stars As IEnumerable(Of Star)
        Get
            Return mStars
        End Get
    End Property

    Public Sub New()
        mStars = StarStatisticsLoader.Load("/Data/starsdata.csv")
    End Sub
End Class

Public Module StarStatisticsLoader
    Public Function Load(ByVal filepath As String) As IEnumerable(Of Star)
        Dim streamInfo As StreamResourceInfo = Application.GetResourceStream(
                New Uri(filepath, UriKind.RelativeOrAbsolute)
            )
        Dim reader As StreamReader = New StreamReader(streamInfo.Stream)
        Dim stars As Collection(Of Star) = New Collection(Of Star)()
        While (Not reader.EndOfStream)
            Dim dataLine As String = reader.ReadLine()
            Dim serializedValues As String() = dataLine.Split(";")
            stars.Add(
                    New Star(
                        id:=Convert.ToInt32(serializedValues(0), CultureInfo.InvariantCulture),
                        x:=Convert.ToDouble(serializedValues(3), CultureInfo.InvariantCulture),
                        y:=Convert.ToDouble(serializedValues(4), CultureInfo.InvariantCulture),
                        z:=Convert.ToDouble(serializedValues(5), CultureInfo.InvariantCulture),
                        spectr:=serializedValues(1),
                        luminocity:=Convert.ToDouble(serializedValues(6), CultureInfo.InvariantCulture),
                        colorIndex:=Convert.ToDouble(serializedValues(2), CultureInfo.InvariantCulture)
                    )
                )
        End While
        Return stars
    End Function
End Module
买 DevExpress Universal Subscription 免费赠 万元汉化资源包1套!
限量15套!先到先得,送完即止!立即抢购>>
本站文章除注明转载外,均为本站原创或翻译
欢迎任何形式的转载,但请务必注明出处,尊重他人劳动成果
转载请注明:文章转载自:DevExpress控件中文网 [https://www.devexpresscn.com/]
本文地址:https://www.devexpresscn.com/post/1139.html
欢迎任何形式的转载,但请务必注明出处,尊重他人劳动成果
转载请注明:文章转载自:DevExpress控件中文网 [https://www.devexpresscn.com/]
本文地址:https://www.devexpresscn.com/post/1139.html


 返回
返回