 联系电话:023-68661681
DXperience Windows 8 XAML 是DevExpress于2012年全新推出的一款用户界面套包,专门针对Windows8平台。使用它可以创建引人注目的触摸式的Win8商业解决方案,其强大的数据处理能力能满足最终用户的需求。>>下载
创建项目
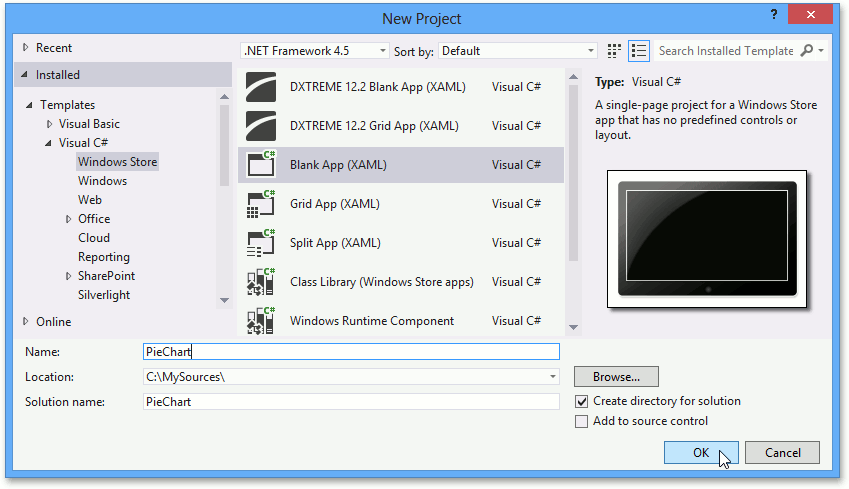
首先运行VS2012,在Visual Studio中按下Ctrl+Shift+N选择Windows Store,然后选中Blank App(XAML),可以将应用程序命名为"PieChart"然后单击OK。
然后找到MainPage.xaml设计视窗,添加PieChart到主页面,直接拖放过去就可以了,如下图:

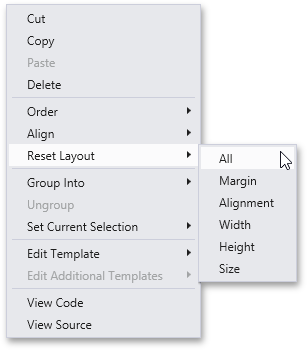
右键单击PieChart项并选择Reset Layout | All选项,这样图表就会填充满整个窗口:
参考代码:
<Page

    xmlns="http://schemas.microsoft.com/winfx/2006/xaml/presentation"
    xmlns:x="http://schemas.microsoft.com/winfx/2006/xaml"
    xmlns:local="using:PieChart"
    xmlns:d="http://schemas.microsoft.com/expression/blend/2008"
    xmlns:mc="http://schemas.openxmlformats.org/markup-compatibility/2006"
    xmlns:Charts="using:DevExpress.UI.Xaml.Charts"
    x:Class="PieChart.MainPage"
    mc:Ignorable="d">

    <Grid Background="{StaticResource ApplicationPageBackgroundThemeBrush}">

        <Charts:PieChart/>

    </Grid>
</Page>
添加图表数据
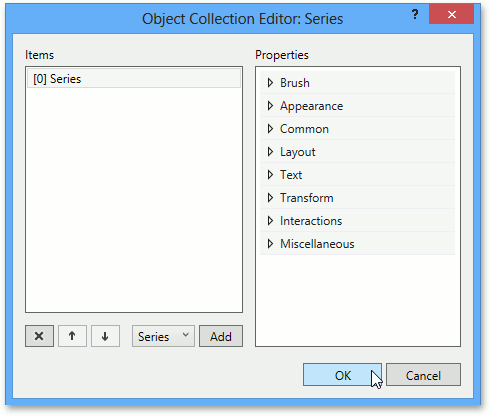
找到ChartBase.Series属性并单击省略号按钮,弹出Object Collection Editor: Series对话框,添加Series对象到属性集合中,如下图:
接下来为序列指定一个序列视图,通过设置 Series.View 属性到 PieSeriesView:
<Charts:Series>
   <Charts:Series.View>
      <Charts:PieSeriesView/>
   </Charts:Series.View>
</Charts:Series>
将以下代码添加到序列中,就可以为图表添加数据:
<Charts:Series>
   <Charts:Series.View>
      <Charts:PieSeriesView/>
   </Charts:Series.View>
   <Charts:Series.Data>
      <Charts:DataPointCollection ArgumentScaleType="Qualitative">
         <Charts:DataPoint Argument="USA" Value="9.63142" />
         <Charts:DataPoint Argument="Canada" Value="9.98467" />
         <Charts:DataPoint Argument="Russia" Value="17.0752" />
         <Charts:DataPoint Argument="Others" Value="81.2" />
         <Charts:DataPoint Argument="India" Value="3.28759" />
         <Charts:DataPoint Argument="Australia" Value="7.68685" />
         <Charts:DataPoint Argument="Brazil" Value="8.511965" />
         <Charts:DataPoint Argument="China" Value="9.59696" />
      </Charts:DataPointCollection>
   </Charts:Series.Data>
</Charts:Series>
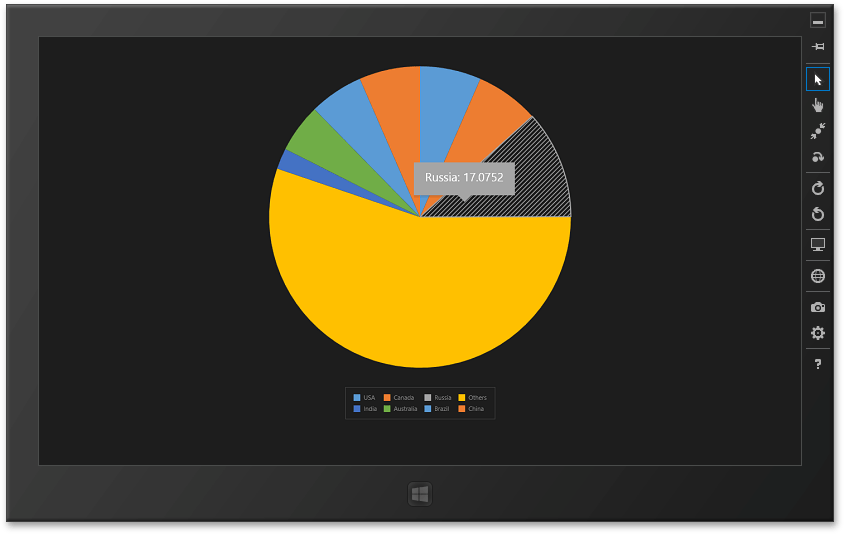
完整代码如下,其中对图表进行了一些自定义,让它看起来更漂亮:
<Page


    xmlns="http://schemas.microsoft.com/winfx/2006/xaml/presentation"
    xmlns:x="http://schemas.microsoft.com/winfx/2006/xaml"
    xmlns:local="using:PieChart"
    xmlns:d="http://schemas.microsoft.com/expression/blend/2008"
    xmlns:mc="http://schemas.openxmlformats.org/markup-compatibility/2006"
    xmlns:Charts="using:DevExpress.UI.Xaml.Charts"
    x:Class="PieChart.MainPage"
    mc:Ignorable="d">

    <Grid Background="{StaticResource ApplicationPageBackgroundThemeBrush}">

        <Charts:PieChart Margin="50" ToolTipEnabled="True">
            <Charts:Series>
                <Charts:Series.View>
                    <Charts:PieSeriesView LegendPointPattern="{}{A}"/>
                </Charts:Series.View>
                <Charts:Series.Data>
                    <Charts:DataPointCollection>
                        <Charts:DataPoint Argument="USA" Value="9.63142" />
                        <Charts:DataPoint Argument="Canada" Value="9.98467" />
                        <Charts:DataPoint Argument="Russia" Value="17.0752" />
                        <Charts:DataPoint Argument="Others" Value="81.2" />
                        <Charts:DataPoint Argument="India" Value="3.28759" />
                        <Charts:DataPoint Argument="Australia" Value="7.68685" />
                        <Charts:DataPoint Argument="Brazil" Value="8.511965" />
                        <Charts:DataPoint Argument="China" Value="9.59696" />
                    </Charts:DataPointCollection>
                </Charts:Series.Data>
            </Charts:Series>
            <Charts:PieChart.Legend>
                <Charts:Legend MaximumRowsOrColumns="4"/>
            </Charts:PieChart.Legend>
        </Charts:PieChart>
    </Grid>
</Page>
本站文章除注明转载外,均为本站原创或翻译
欢迎任何形式的转载,但请务必注明出处,尊重他人劳动成果
转载请注明:文章转载自:DevExpress控件中文网 [https://www.devexpresscn.com/]
本文地址:https://www.devexpresscn.com/post/505.html
欢迎任何形式的转载,但请务必注明出处,尊重他人劳动成果
转载请注明:文章转载自:DevExpress控件中文网 [https://www.devexpresscn.com/]
本文地址:https://www.devexpresscn.com/post/505.html


 返回
返回