

DevExpress XtraCharts示例二:向Web应用程序中添加图表
作者:zhuhm 来源:本站原创 浏览:Loading...次 发布时间:2012-09-17 评论:0条
本示例主要介绍如何在设计时和运行时添加WebChartControl到web页面。
设计时
默认情况下, WebChartControl项目被添加到VS IDE下的DX.12.1: Data 工具箱选项卡。因此,若要Web Chart图表控件添加到您的项目中,你只需要拖动相应的工具箱项目,然后将其放置到窗体上。
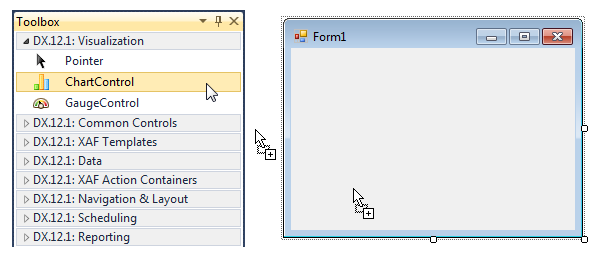
接下来,你可以在图表中添加2D和3D系列,并且用数据填充。
运行时
1、建一个新的ASP.NET Web应用程序(Visual Studio 2008或2010),或打开一个现有的ASP.NET Web应用程序。
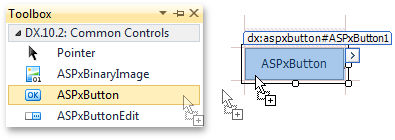
2、切换到Default.aspx 页面的Design视图,将ASPxButton控件从DX.12.1: Common Controls工具箱选项卡中,拖动到页面。接下来,我们将处理Click事件,从而生成web图表。
3、将所需的程序集添加到项目中。
4、双击ASPxButton1,处理Click事件。将如下的代码添加到事件处理器中。
C#
using System;
using DevExpress.XtraCharts;
using DevExpress.XtraCharts.Web;
// ...
protected void ASPxButton1_Click(object sender, EventArgs e) {
// Create a WebChartControl instance.
WebChartControl WebChartControl1 = new WebChartControl();
// Add the chart to the form.
// Note that a chart isn't initialized until it's added to the form's collection of controls.
this.form1.Controls.Add(WebChartControl1);
// Create a line series and add points to it.
Series series1 = new Series("My Series", ViewType.Line);
series1.Points.Add(new SeriesPoint("A", new double[] { 2 }));
series1.Points.Add(new SeriesPoint("B", new double[] { 7 }));
series1.Points.Add(new SeriesPoint("C", new double[] { 5 }));
series1.Points.Add(new SeriesPoint("D", new double[] { 9 }));
// Add the series to the chart.
WebChartControl1.Series.Add(series1);
}
VB
Imports System
Imports DevExpress.XtraCharts
Imports DevExpress.XtraCharts.Web
' ... Protected Sub ASPxButton1_Click(ByVal sender As Object, ByVal e As EventArgs)
' Create a WebChartControl instance.
Dim WebChartControl1 As New WebChartControl()' Add the chart to the form.
' Note that a chart isn't initialized until it's added to the form's collection of controls.
Me.form1.Controls.Add(WebChartControl1)
' Create a line series and add points to it.
Dim series1 As New Series("My Series", ViewType.Line)
series1.Points.Add(New SeriesPoint("A", New Double() { 2 }))
series1.Points.Add(New SeriesPoint("B", New Double() { 7 }))
series1.Points.Add(New SeriesPoint("C", New Double() { 5 }))
series1.Points.Add(New SeriesPoint("D", New Double() { 9 })) ' Add the series to the chart.
WebChartControl1.Series.Add(series1)
End Sub
本站文章除注明转载外,均为本站原创或翻译
欢迎任何形式的转载,但请务必注明出处,尊重他人劳动成果
转载请注明:文章转载自:DevExpress控件中文网 [http://www.devexpresscn.com/]
本文地址:http://www.devexpresscn.com/DevExpress-Resources/Demo-244.html
欢迎任何形式的转载,但请务必注明出处,尊重他人劳动成果
转载请注明:文章转载自:DevExpress控件中文网 [http://www.devexpresscn.com/]
本文地址:http://www.devexpresscn.com/DevExpress-Resources/Demo-244.html
关键字: XtraCharts
评论列表
暂无评论
请谈谈你的看法 请使用IE或者Firefox浏览器,暂不支持Chrome!


慧都控件网为DevExpress界面控件的中国地区唯一正式授权经销商,正版控件销售公司,授权代理商,经销商及合作伙伴。
电话:400-700-1020
023-66090381
邮箱:sales@evget.com
相关资源
- DXCharts创建二维面积图
- ASPxGridView处于客户端插入模式
- 设置ASPxGridView表头过滤器高度
- DXCharts入门手册
- 将ChartControl添加到Windows窗体中
- DevExpress DXCharts入门手册
- jQuery为WebChartControl控件增加交互性
- XtraCharts入门教程一:利用向导创建ASP.NET图表
- Silverlight版本在线演示 Realtor World
- ASP.NET & MVC版本在线演示Webmail客户端
- WPF版本在线演示 Realtor World
- XtraCharts入门教程二:创建一个简单的非绑定图表
- XtraCharts入门教程三:绑定图表系列到数据源
- 利用滚动图例创建一个图表控件
- DXCharts图表控件来自定义图表标题
- XtraCharts入门教程四:使用Series模板自动创建Series
- 如何调用自定义约会表单中的ASPxPopupControl控件?
- 根据活动视图打印ASPxScheduler
- ASP.NET & MVC在线演示ASP.NET & MVC在线演示Touch Board
- XtraCharts示例一:向Windows窗体应用程序中添加图表


